-1791966549842.webp)





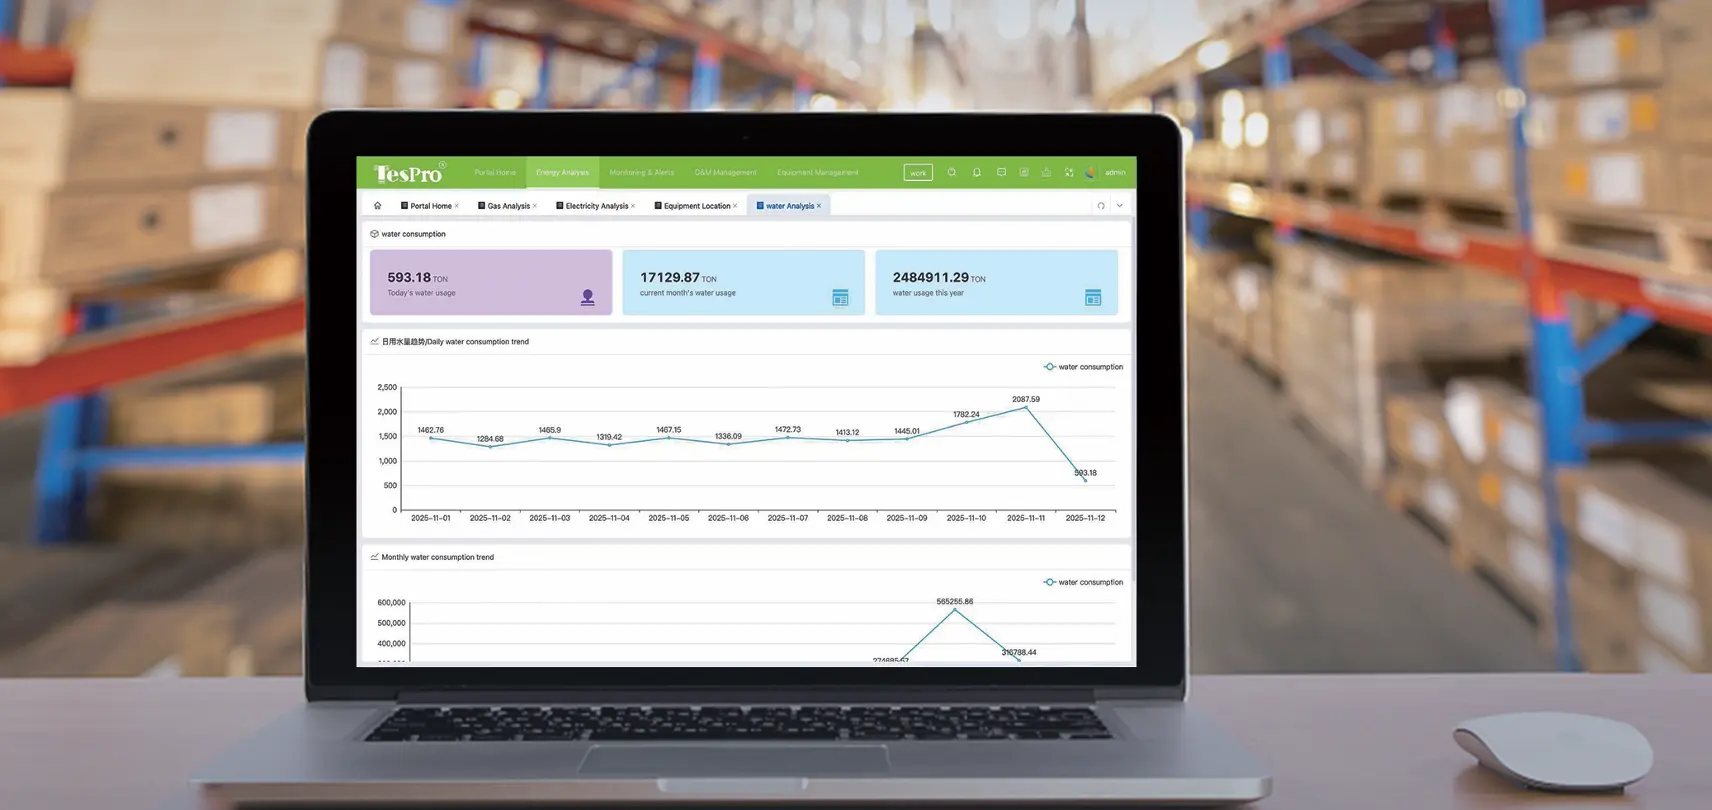

Under traditional energy management, facility administrators need to regularly send staff to manually read water, electricity, and gas meters, then manually enter readings into Excel. This process is time‑consuming, with significant data lag — current month data may not be compiled until mid‑month, making it impossible to detect anomalies promptly. Tespro's energy management platform uses DTUs to collect real‑time water, electricity, and gas meter data, transmitting it back to the cloud via 4G or Ethernet for remote centralized management. Managers simply log into the platform homepage to view current month and year‑to‑date consumption with trend charts, quickly grasping overall energy usage without waiting for manual processes.
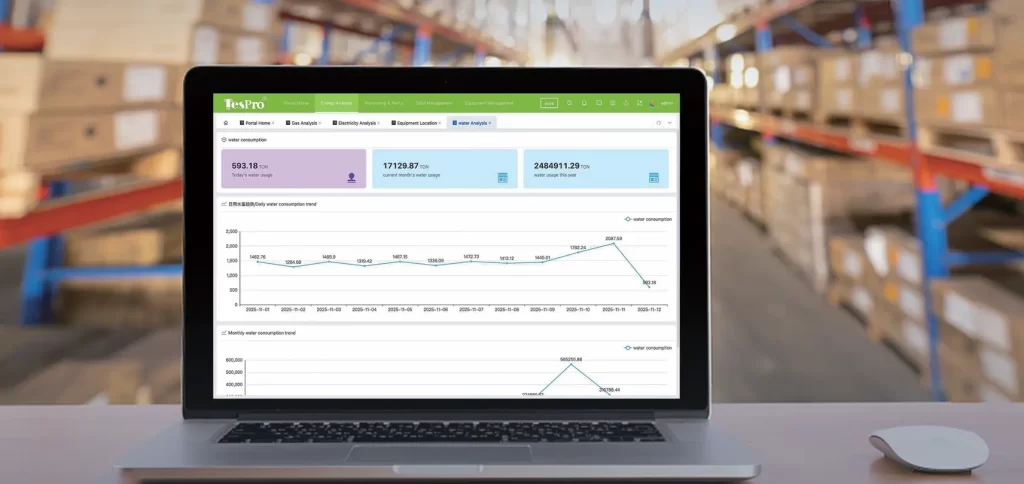
Real‑time data collection transforms energy management from reactive to proactive. In the past, production line anomalies might only be discovered at month‑end settlement, after weeks of waste. Now, managers can detect problems the same day anomalies appear. The platform supports year‑over‑year, month‑over‑month, and daily trend analysis, as well as peak‑flat‑valley electricity analysis, helping optimize usage and reduce costs. For enterprises facing energy reduction targets, real‑time visualized data is the foundation for continuous improvement.
What energy data does the platform support collecting, and at what frequency?
The platform supports water, electricity, and gas meter data — including consumption, voltage, current, and power. Collection frequency is configurable from once per minute to once per hour.
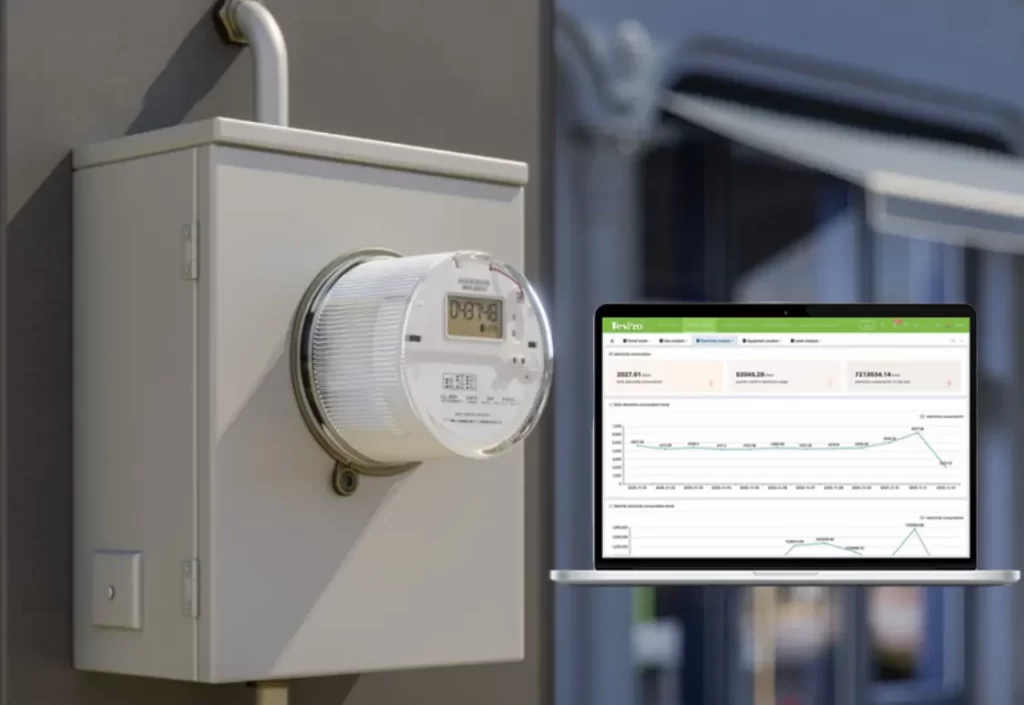
The platform has wide applications: manufacturing facilities can monitor per‑line energy consumption; campuses can track teaching buildings and dormitories; smart parks can enable sub‑metering; hospitals can ensure stable medical equipment power; commercial complexes and office buildings can optimize common area energy usage. For any organization seeking data‑driven energy management, Tespro's platform is a practical, easy‑to‑deploy tool.